When assessing national wealth and identifying Richest Countries in the world, GDP per capita—the total economic output of a country divided by its population—is one of the most widely used indicators. It provides a snapshot of average economic prosperity and is particularly useful when comparing countries of different sizes. According to Mankiw (2021), GDP per capita is a fundamental measure of a country’s economic performance and potential standard of living. However, this metric does not account for cost of living, income inequality or non-market transactions (Investopedia, 2023).
This article explores the 15 wealthiest countries in 2025 based on nominal GDP per capita (measured in current US dollars), drawing from the most recent estimates by the International Monetary Fund (IMF) and reputable economic platforms.
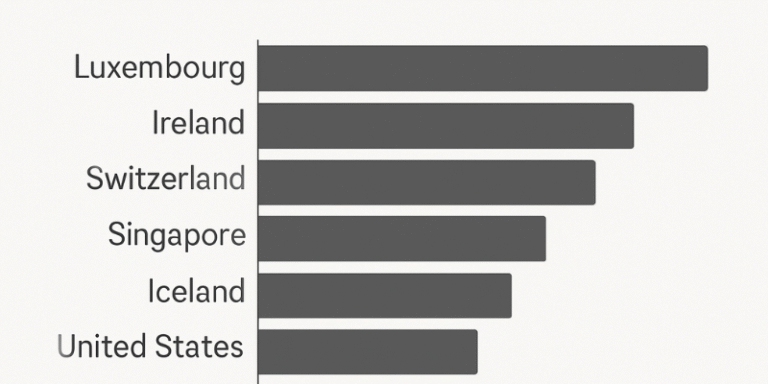
Top 15 Richest Countries by Nominal GDP per Capita
| Rank | Country/Territory | GDP per Capita (USD) |
| 1 | Luxembourg | 140,941 |
| 2 | Ireland | 108,919 |
| 3 | Switzerland | 104,896 |
| 4 | Singapore | 92,932 |
| 5 | Iceland | 90,284 |
| 6 | Norway | 89,694 |
| 7 | United States | 89,105 |
| 8 | Macao SAR | 76,314 |
| 9 | Denmark | 74,969 |
| 10 | Qatar | 71,653 |
| 11 | Netherlands | 70,480 |
| 12 | Australia | 64,547 |
| 13 | San Marino | 59,603 |
| 14 | Austria | 58,192 |
| 15 | Sweden | 58,100 |
Source: IMF (2025); World Population Review (2025); Visual Capitalist (2025)
Country Highlights
1.0 Luxembourg
Luxembourg tops the list due to its robust financial services sector, strong regulation, and open economy. Its wealth is significantly influenced by the presence of international banks and investment firms, as well as a small population that magnifies per capita calculations (Global Citizen Solutions, 2025; IMF, 2025).
2.0 Ireland
Ireland has attracted substantial foreign direct investment, especially from multinational tech and pharmaceutical companies. Its low corporate tax rate and access to EU markets have made it a European hub for giants like Apple, Google, and Pfizer (OECD, 2023; World Bank, 2024).
3.0 Switzerland
Known for banking, insurance, precision engineering, and pharmaceuticals, Switzerland also benefits from political neutrality, a highly educated workforce, and advanced infrastructure. High productivity and low corruption further enhance its economic output (World Bank, 2024; Visual Capitalist, 2025).
4.0 Singapore
A global trading and financial centre, Singapore benefits from strategic geography, highly skilled labour, and cutting-edge innovation. Its economy is diversified, ranging from biotechnology to finance and electronics (Economics Insider, 2025).
5.0 Iceland
Iceland’s wealth is driven by renewable energy, tourism, and fisheries. Its economy is relatively small but highly productive, with a high standard of living, social cohesion, and environmental sustainability (Adam and Alzuman, 2024).
6.0 Norway
Norway’s wealth stems from oil and gas exports, prudent fiscal policy, and the world’s largest sovereign wealth fund. It combines high GDP per capita with strong education, healthcare, and public welfare systems (UNDP, 2024; IMF, 2025).
7.0 United States
The U.S. has the largest total GDP globally, and its per capita income remains high due to innovation, a dynamic private sector, and dominance in sectors like technology, defence, and healthcare. However, it also exhibits high income inequality (Ravikumar et al., 2024).
8.0 Macao SAR
Macao’s economy is centred around gaming and tourism, contributing nearly half its GDP. Its wealth is driven by casinos, hotels, and associated services, though it is vulnerable to external shocks and tourism declines (World Population Review, 2025).
9.0 Denmark
Denmark boasts a strong welfare model, balanced public finances, and a highly developed industrial base. It ranks highly in innovation, education, and quality of life. Sectors such as pharmaceuticals, agriculture, and renewable energy contribute to its prosperity (World Bank, 2024).
10.0 Qatar
Qatar’s income is predominantly from liquefied natural gas (LNG) and oil exports. With a small citizen population, high hydrocarbon revenues result in an elevated GDP per capita. The country is investing in infrastructure and diversification under Vision 2030 (Adam and Alzuman, 2024).
11.0 Netherlands
The Dutch economy is export-oriented, with key sectors including agriculture, chemicals, machinery, and energy. Its ports and logistics infrastructure—such as the Port of Rotterdam—make it one of the most globally connected nations (OECD, 2023; Visual Capitalist, 2025).
12.0 Australia
Australia enjoys wealth from mining, education exports, and financial services. High wages, urbanisation, and social services maintain high living standards. Its economic links with China and Southeast Asia support trade resilience (Global Citizen Solutions, 2025).
13.0 San Marino
As one of the smallest countries in Europe, San Marino’s economy is supported by banking, tourism, and tax-efficient policies. Its low debt levels and close ties with Italy offer additional economic stability (World Population Review, 2025).
14.0 Austria
Austria benefits from a strong industrial base, high wages, and robust welfare services. It has a diversified economy with strengths in manufacturing, tourism, and finance. Its location in central Europe supports a healthy export sector (World Bank, 2024).
15.0 Sweden
Sweden is a leader in innovation, with major firms in automotive, telecommunications, and green technology. Its economy balances high productivity with generous public services, universal healthcare, and free education (UNDP, 2024; Mankiw, 2021).
Emerging Trends and Caveats
Role of Tax Policies and Financial Structures
Many of the top-ranking countries—such as Ireland, Luxembourg, and the Netherlands—benefit from being financial hubs with favourable corporate tax environments. These structures attract multinationals, often inflating GDP figures (OECD, 2023).
Small States, Big Numbers
Microstates like San Marino and Macao often appear in the top rankings due to small populations, which boost GDP per capita figures. However, such statistics may not accurately represent broad-based prosperity (Investopedia, 2023).
Purchasing Power Parity (PPP) Considerations
While nominal GDP per capita reflects global dollar values, it doesn’t account for cost of living. For instance, the same income in Switzerland buys far less than in Qatar or Singapore. PPP-adjusted figures may better reflect actual living standards (World Bank, 2024).
Wealth vs. Equality
High average income doesn’t always equate to equitable wealth distribution. Countries like the U.S. and Qatar exhibit significant income inequality, which undermines the assumption that high GDP per capita reflects widespread prosperity (Ravikumar et al., 2024).
Beyond GDP: Broader Measures of Prosperity
GDP per capita is a narrow lens. Countries like Norway, Sweden, and Austria also rank high in the United Nations Human Development Index (HDI), which considers life expectancy, education, and income (UNDP, 2024). On the other hand, economies such as Qatar or Macao may excel economically but underperform in areas like democratic rights or environmental sustainability.
The 15 richest countries in the world in 2025 include a mix of resource-rich states, financial hubs, and innovation-led economies. While GDP per capita provides useful insights into economic output per person, it must be supplemented with PPP comparisons, income distribution data, and human development indicators to form a complete picture of national wellbeing.
Ultimately, economic wealth remains a valuable—but incomplete—measure of prosperity. For policy-makers and citizens alike, understanding the context behind the numbers is key to interpreting what “rich” really means in the modern world.
References
Adam, N.A. and Alzuman, A., 2024. Effect of per capita income, GDP growth, FDI, sectoral composition, and domestic credit on employment patterns in GCC countries: GMM and OLS approaches. Economies, 12(11), p.315.
Economics Insider, 2025. Top 25 Richest Countries in the World by GDP per Capita in 2025. [online] Available at: https://economicsinsider.com/top-25-richest-countries-in-the-world [Accessed 30 Jul. 2025].
Global Citizen Solutions, 2025. Richest Countries in the World by GDP per Capita. [online] Available at: https://www.globalcitizensolutions.com/richest-countries-in-the-world [Accessed 30 Jul. 2025].
IMF, 2025. World Economic Outlook: April 2025 Dataset. [online] Available at: https://www.imf.org/en/Publications/WEO [Accessed 30 Jul. 2025].
Investopedia, 2023. GDP per Capita: Definition, Formula, Comparisons. [online] Available at: https://www.investopedia.com/terms/g/gdppercapita.asp [Accessed 30 Jul. 2025].
Kitov, I., 2005. Real GDP per Capita in Developed Countries. ResearchGate. Available at: https://www.researchgate.net/publication/277069436 [Accessed 30 Jul. 2025].
Mankiw, N.G., 2021. Principles of Economics. 9th ed. Boston: Cengage Learning.
OECD, 2023. Corporate Tax Statistics: Fourth Edition. [online] Available at: https://www.oecd.org/tax/tax-policy [Accessed 30 Jul. 2025].
Ravikumar, B., Chinagorom-Abiakalam, D. and Smaldone, A., 2024. Convergence or Divergence? A Look at GDP Growth Across Richer and Poorer Countries. St. Louis Fed. [online] Available at: https://www.stlouisfed.org/on-the-economy [Accessed 30 Jul. 2025].
UNDP, 2024. Human Development Report 2024. [online] Available at: https://hdr.undp.org [Accessed 30 Jul. 2025].
Visual Capitalist, 2025. Ranked: The 50 Richest Countries by GDP Per Capita in 2025. [online] Available at: https://www.visualcapitalist.com [Accessed 30 Jul. 2025].
World Bank, 2024. World Development Indicators. [online] Available at: https://data.worldbank.org [Accessed 30 Jul. 2025].
World Population Review, 2025. GDP Per Capita by Country. [online] Available at: https://worldpopulationreview.com/country-rankings/gdp-per-capita-by-country [Accessed 30 Jul. 2025].